Optimizing an application’s performance is essential for delivering a high-quality solution that meets the needs of end users. We employ several tools and techniques to achieve this, such as caching, minification, lazy loading, batching, etc. We’re also able to perform PHP profiling to identify and address performance issues like memory leaks, slow database queries, and excessive CPU usage. Incorporating PHP profiling into the implementation and maintenance phases of the development process provides us valuable insights and myriad benefits.
How does profiling improve the development phase?
We can perform PHP profiling to identify performance bottlenecks during the development phase of the Software Development Life Cycle (SDLC). A profiler measures resource consumption and execution time to identify areas of the application that are consuming the most resources and delaying execution (Figure 1). Identifying these bottlenecks early in the SDLC enables us to optimize code for improved quality and performance as we develop applications.
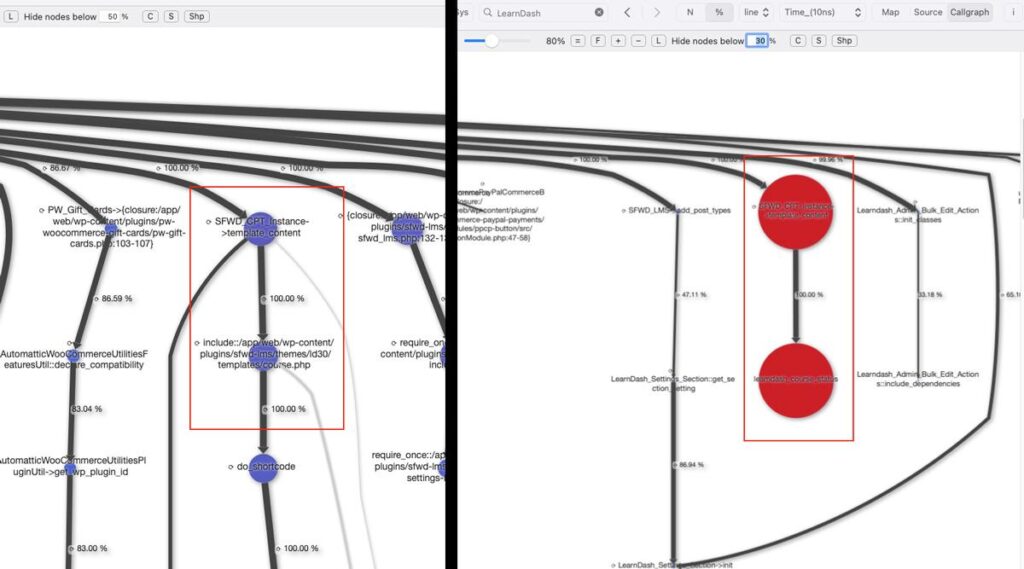
Profiling also allows us to benchmark performance, ensuring request processing meets desired performance metrics. For example, if an application needs to load a page within 2 seconds, we can profile the request to identify areas that might benefit from optimization.
Profiling can also aid in identifying issues with third-party libraries or dependencies that negatively impact performance, enabling us to address them quickly. And as we build increasingly complex applications and systems that utilize many third-party packages, profiling to get a clear performance snapshot becomes increasingly important.
How does profiling improve the maintenance phase?
We can also perform PHP profiling post-production to ensure that an application’s performance remains optimized. As a production application’s usage patterns change and its data volumes increase over time, performance bottlenecks that didn’t exist during development can begin to emerge.
Profiling requests to identify new bottlenecks and areas needing optimization is essential for web applications where user experience is crucial. Slow-loading pages can lead to frustration and lost business. Regular profiling of critical parts of the application or profiling after significant changes or updates can ensure that an application’s performance remains optimized over time.
Slow applications frustrate users and negatively impact the user experience. By identifying and optimizing performance bottlenecks, we can improve an application’s speed and responsiveness, enhancing its usability. Profiling can also aid in identifying memory leaks and other significant issues impacting an application’s stability. Addressing these issues can prevent slow or failed requests and ensure an application is stable and reliable.
What are some PHP profiling tools that we utilize?
- New Relic
NewRelic is a cloud-based tool that provides real-time insights into the performance of web and mobile applications, servers, and other components of a tech stack. PHP profiling is provided as a part of NewRelic’s application performance monitoring (APM) capabilities. It enables us to monitor and analyze the performance of an application in development, staging, and production environments. - XDebug
Xdebug’s PHP profiler is a powerful tool for analyzing the performance of PHP applications. We use it in local development environments where we’re able to work on updates without affecting corresponding remote environments. Xdebug generates Cachegrind profile data files containing detailed information about the execution time and resource consumption of called functions. We’re then able to use a Cachegrind viewer to view a graphical representation of the profile data to gain insight into code performance and to aid us in identifying and fixing issues quickly and efficiently (Figure 1).
How did PHP profiling recently help to improve a data migration process?
Recently, I encountered an issue where it appeared that migrating a large dataset from Joomla to WordPress would take too long. There were 66,454 records to process, and I estimated that at an average of 6 seconds per request, it would take 4+ days!
Profiling the process showed WordPress’ do_action() (Figure 2) method getting called frequently. WordPress makes many calls to do_action() that other parts of the application hook into. In addition, the application has many active plugins that make many calls to do_action(). These calls are a normal part of WordPress’ functionality and were only an issue with respect to the migration process.
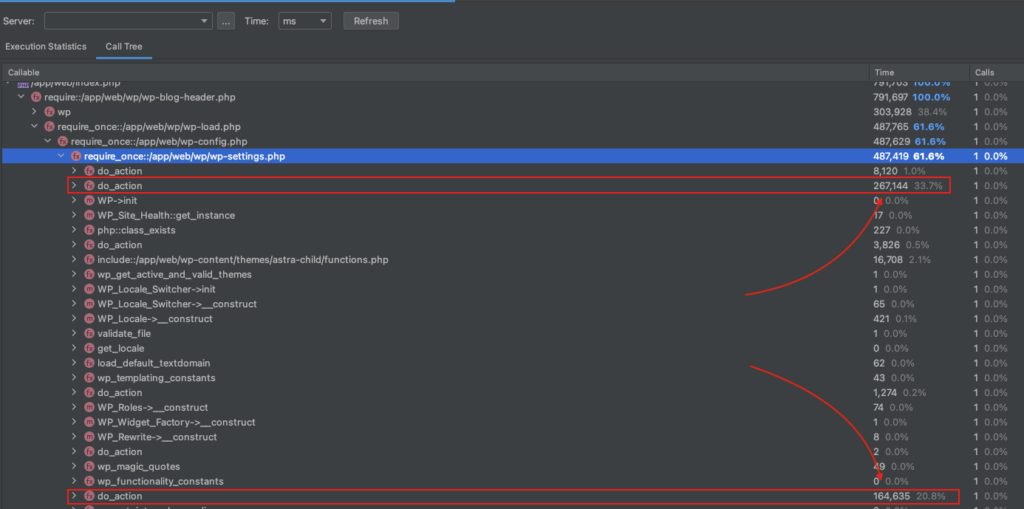
Because the migration script didn’t need most of the active plugins, the number of do_action() calls could be reduced by temporarily disabling the unneeded plugins (Figure 3). Disabling the plugins cut the request time by 4 seconds, reducing the estimated migration time from 4+ days to 18 hours!
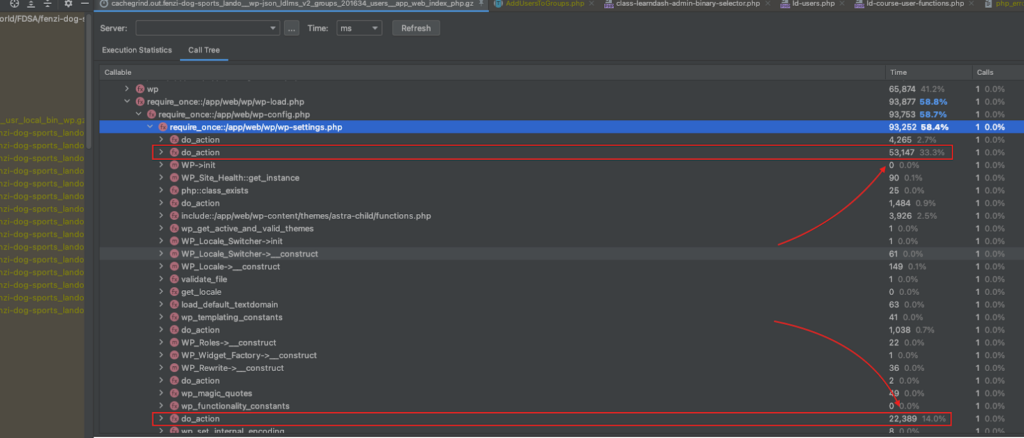
My hindsight bias tells me it should’ve already been clear to me that I needed to disable all unneeded plugins. Fortunately, profiling made it immediately clear.
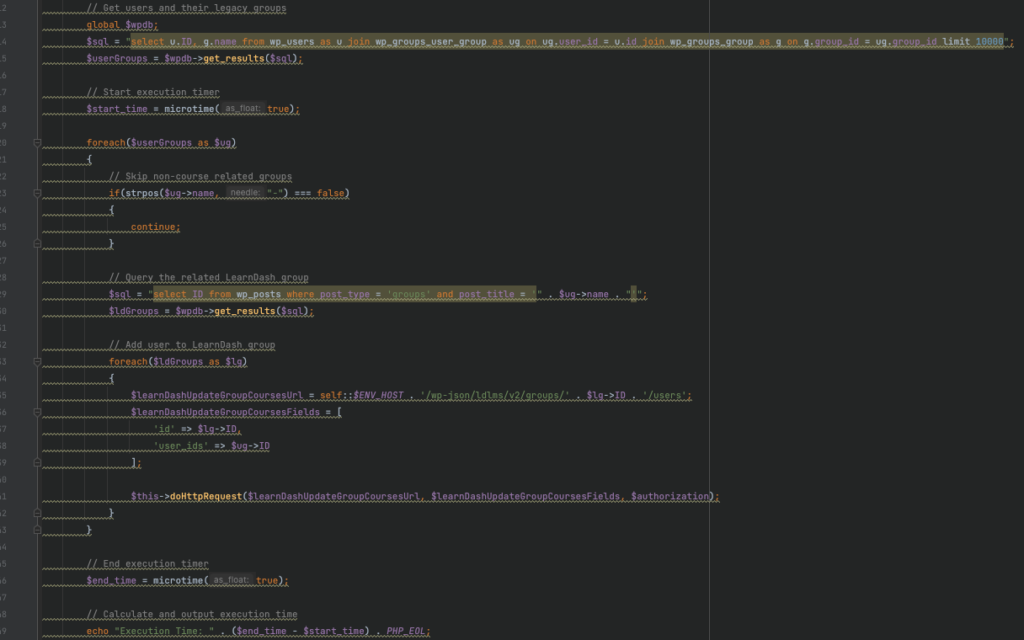
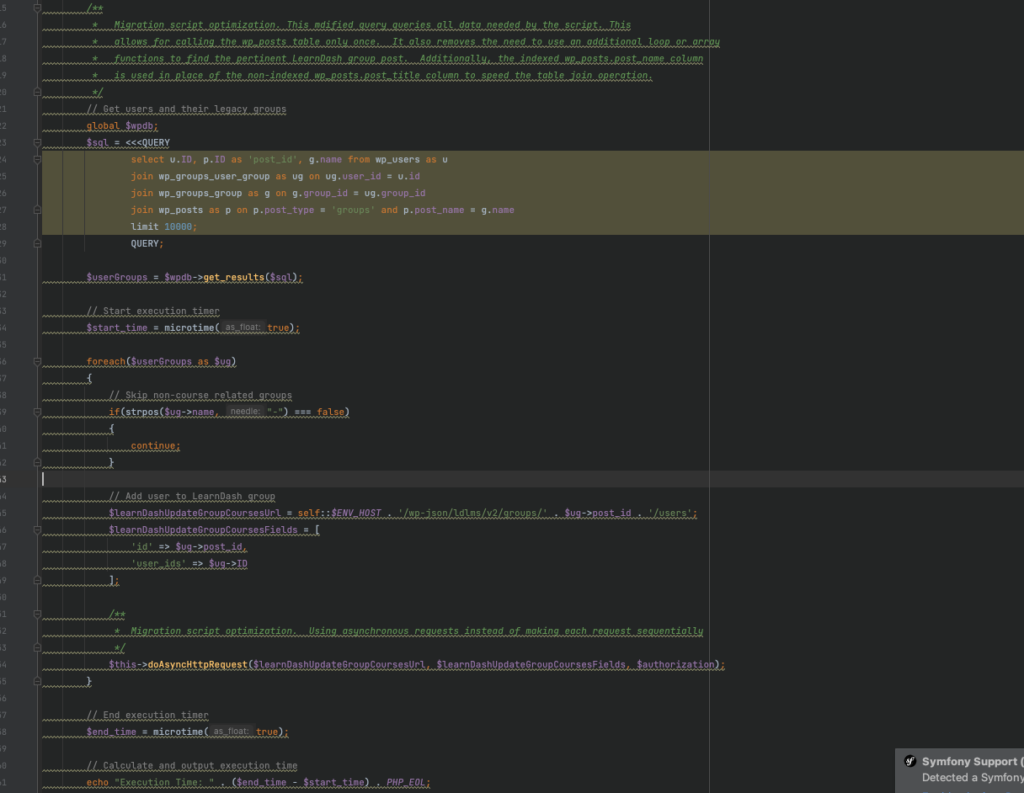
I improved the migration process further by optimizing the script. I modified the first database query to pull all needed data at the beginning of the script execution; this can be much faster than iterating and searching through datasets using nested loops and array functions (Figure 4). It also removed the nested foreach() loop and second query (Figure 5). I modified the query further by using the already indexed wp_posts.post_name column instead of the non-indexed wp_posts.post_title column to match relevant posts. Lastly, I used an async library to enable sending concurrent requests, and I added the HTTP keep-alive request header to reuse a single TCP connection, which can also improve performance.
Surprisingly, these improvements made only a slight difference. I used the most basic form of PHP profiling to measure the execution time – the built-in microtime() function (Figure 4 & 5).
I tested the optimized script against the original version by measuring the processing time to migrate 654 records (1% of the dataset), and found that it provided a 3.8% reduction in processing time. The original script took 422 seconds (Figure 6), and the optimized script 406. With that in mind, I estimated that migrating the entire data set with the original script would take 11.72 hours and migrating the dataset with the optimized script would take 11.28 hours — a 27-minute improvement. Twenty-seven minutes is only a slight improvement, but the gain would be more significant with a larger dataset. For instance, the improvement would be days with a dataset 100 times larger.
Note: My initial estimate of 18 hours was arrived at while migrating locally. The 11 hour estimate here was arrived at while migrating to the remote environment. Surprisingly, testing migrations locally can be slower than migrating remotely. This is due to the slower performance of local development environments.

Conclusion
PHP profiling is a powerful technique that can enhance an application’s performance and usability. Incorporating it into our development and maintenance phases helps us to identify and optimize performance bottlenecks, improve an application’s stability, and enhance the user experience. With regular profiling, we can deliver higher quality solutions ensuring that an application is stable and that its performance remains optimized over time.

One response to “Delivering Higher Quality Solutions with Application Profiling”
Hi, i feel that i saw you visited my site so i got here to return the want?.I’m attempting to in finding issues to improve my web site!I guess its adequate
to use a few of your concepts!!